Task
The team kept its records in Excel. The manager needed to know which jobs made money and which ran at a loss, and use those figures when planning the team's workload.
Solution
I built a C#/.NET app that links work, costs and income. It calculates the result for each job, while summaries help compare orders. The manager can see where the team earned money and where costs consumed the revenue.
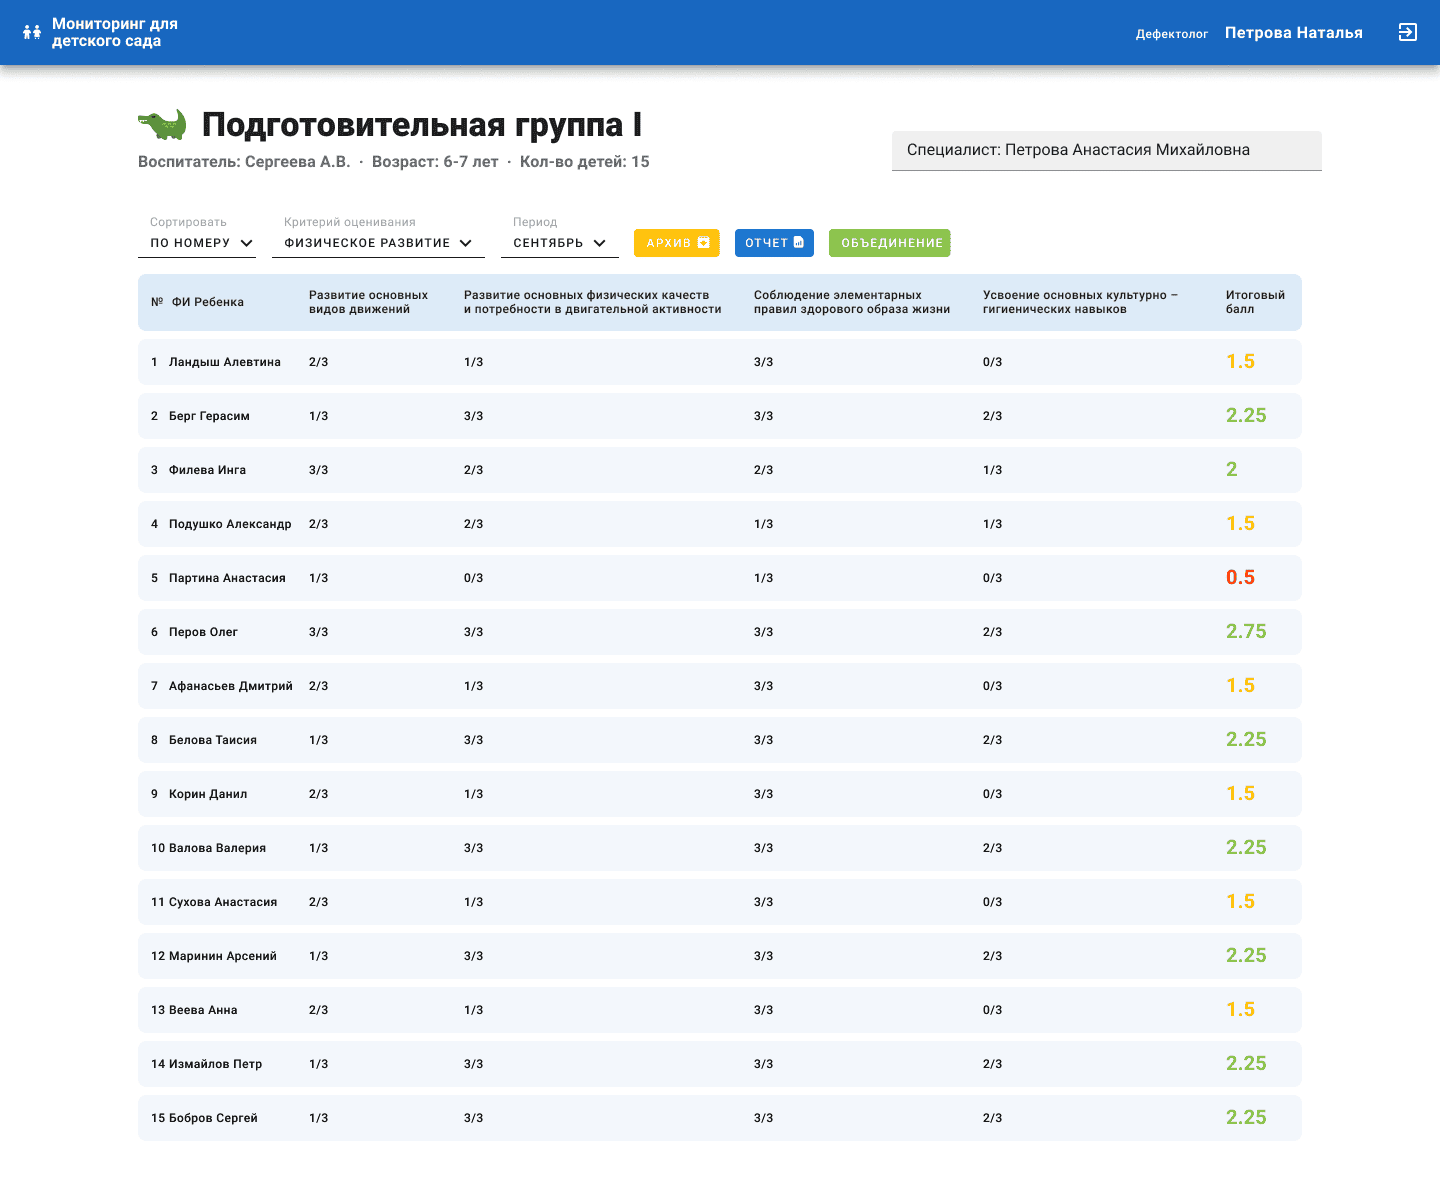
The interactive demonstration lets visitors try this workflow with production orders. Create an order, enter materials and planned hours, then log time. The report shows the plan, actual costs and forecast margin; the team view shows committed and available time.
What was done
- Brought completed work, costs and income together in one app
- Built a result calculation for each job in C#/.NET
- Added summary figures for comparing orders
- Gave the manager data for workload decisions
Result
10 staff handle about 80 orders a month instead of Excel sheets. For each job, the manager can see how much remains after costs and which orders ran at a loss. These totals inform workload planning.
These are usage figures from the working app. The demo shows a smaller selection of fictional orders and employees so visitors can try the workflows without client data.
Developer's note

What was hard
The main challenge in this kind of accounting is what the figures mean. A contract amount is not earnings, and costs on an unfinished job do not represent its final result. Each figure needs a clear basis and a clear purpose.
When preparing the demonstration, I separated the plan, actuals and forecast. New orders reserve time, overruns reduce the expected margin, and completion releases unused hours. Cards, the report and team capacity must reflect these changes consistently.
What came easy
The arithmetic itself is straightforward. The core records are jobs and their related costs and income. Keeping them together makes it possible to calculate and display the result without moving numbers between spreadsheets by hand.
All sections of the demonstration use one list of orders. Updating an order's hours or status recalculates the other figures. This made the workflow easier to understand and check from start to finish.
Technologies
C#.NET